Context
- Track the sell rate at a transaction size of 10,000,000 VND
- Strip out the ad price sitting at the top (which skews quite far from the market rate)
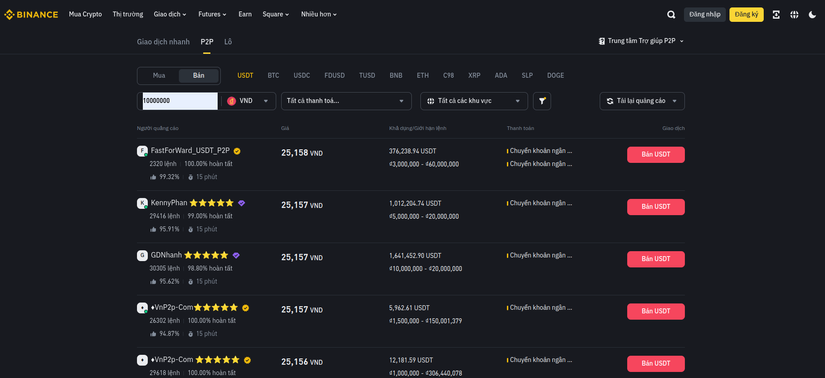
Given that, I figured I'd just build it myself. In this post I'll walk through the "quick and dirty" process of building a system to store and track the USDT/VND exchange rate history.
To build a system that can chart price history, I used 3 components:
- Scraper (Python): to scrape data directly from the Binance page
- Prometheus: to store the exchange rate history long-term.
- Grafana: the familiar companion tool to Prometheus, to visualize it as a chart.
Scraper (Python)
Starting with scraping data from Binance's P2P page to get the exchange rate. I chose to grab the 3 closest prices and average them to reduce the gap with the real rate. The following code runs in 1 thread and scrapes a new price every 10 minutes. I picked 10 minutes because scraping more frequently risks getting blocked.
The data gets returned as JSON at path /:
from flask import Flask, jsonify
import requests
import json
import threading
import time

app = Flask(__name__)

# Initialize variables
usdtvnd = 0

def update_usdt_vnd():
    global usdtvnd  # Access the global variable

    headers = {
        'Accept': '*/*',
        'Accept-Language': 'vi,vi-VN;q=0.9,en;q=0.8',
        'C2CType': 'c2c_web',
        'ClientType': 'web',
        'Content-Type': 'application/json',
        'Lang': 'vi',
        'Origin': 'https://p2p.binance.com',
        'Referer': 'https://p2p.binance.com/trade/sell/USDT?fiat=VND&payment=all-payments',
        'User-Agent': 'Mozilla/5.0 (X11; Linux x86_64) AppleWebKit/537.36 (KHTML, like Gecko) Chrome/123.0.0.0 Safari/537.36',
        'X-Passthrough-Token': ''  # Replace with your actual token if needed
    }

    data = {
        "fiat": "VND",
        "page": 1,
        "rows": 3,
        "tradeType": "SELL",
        "asset": "USDT",
        "countries": ["VN"],
        "proMerchantAds": False,
        "shieldMerchantAds": False,
        "filterType": "all",
        "additionalKycVerifyFilter": 0,
        "publisherType": None,
        "payTypes": [],
        "classifies": ["mass", "profession"],
        "transAmount": 10000000
    }

    url = 'https://p2p.binance.com/bapi/c2c/v2/friendly/c2c/adv/search'

    try:
        response = requests.post(url, headers=headers, json=data)
        response.raise_for_status()

        # Parse JSON data
        data = json.loads(response.text)

        # Extract prices and calculate average
        prices = []
        for item in data["data"]:
            price = float(item["adv"]["price"])
            prices.append(price)

        usdtvnd = round(sum(prices) / len(prices), 0)

    except requests.exceptions.RequestException as e:
        print(f"Error fetching data: {e}")

    # Schedule next update after 10 minutes
    threading.Timer(600, update_usdt_vnd).start()

# Start background thread to update price every 10 minutes
update_usdt_vnd()

@app.route('/')
def get_average_price():
    return jsonify({'USDT/VND': int(usdtvnd)})

if __name__ == '__main__':
    app.run(host='0.0.0.0', debug=True)
When you access port 5000, you'll get a value like {'USDT/VND': 25100}. So we've now got the USDT rate at the current moment.
Next, our job is to expose this data in a format Prometheus can read and store. In this post I use a Python Exporter with the prometheus_client library. Here's the code after adding the metrics-exposing logic for Prometheus:
from flask import Flask, jsonify
import requests
import json
import threading
import time
from prometheus_client import start_http_server, Gauge, generate_latest

app = Flask(__name__)

# Initialize variables
usdtvnd = 0

# Prometheus metrics
usdt_vnd_gauge = Gauge('usdt_vnd', 'USDT to VND exchange rate') # Declare metric

def update_usdt_vnd():
    global usdtvnd  # Access the global variable

    headers = {
        'Accept': '*/*',
        'Accept-Language': 'vi,vi-VN;q=0.9,en;q=0.8',
        'C2CType': 'c2c_web',
        'ClientType': 'web',
        'Content-Type': 'application/json',
        'Lang': 'vi',
        'Origin': 'https://p2p.binance.com',
        'Referer': 'https://p2p.binance.com/trade/sell/USDT?fiat=VND&payment=all-payments',
        'User-Agent': 'Mozilla/5.0 (X11; Linux x86_64) AppleWebKit/537.36 (KHTML, like Gecko) Chrome/123.0.0.0 Safari/537.36',
        'X-Passthrough-Token': ''  # Replace with your actual token if needed
    }

    data = {
        "fiat": "VND",
        "page": 1,
        "rows": 3,
        "tradeType": "SELL",
        "asset": "USDT",
        "countries": ["VN"],
        "proMerchantAds": False,
        "shieldMerchantAds": False,
        "filterType": "all",
        "additionalKycVerifyFilter": 0,
        "publisherType": None,
        "payTypes": [],
        "classifies": ["mass", "profession"],
        "transAmount": 10000000
    }

    url = 'https://p2p.binance.com/bapi/c2c/v2/friendly/c2c/adv/search'

    try:
        response = requests.post(url, headers=headers, json=data)
        response.raise_for_status()

        # Parse JSON data
        data = json.loads(response.text)

        # Extract prices and calculate average
        prices = []
        for item in data["data"]:
            price = float(item["adv"]["price"])
            prices.append(price)

        usdtvnd = round(sum(prices) / len(prices), 0)

        # Update Prometheus metrics
        usdt_vnd_gauge.set(usdtvnd) # Update value for usdt_vnd metric

    except requests.exceptions.RequestException as e:
        print(f"Error fetching data: {e}")

    # Schedule next update after 10 minutes
    threading.Timer(600, update_usdt_vnd).start()

# Start background thread to update price every 10 minutes
update_usdt_vnd()

@app.route('/')
def get_average_price():
    return jsonify({'USDT/VND': int(usdtvnd)})

@app.route('/metrics')
def metrics():
    # Return the metrics for Prometheus
    return generate_latest(), 200, {'Content-Type': 'text/plain; charset=utf-8'}

if __name__ == '__main__':
    app.run(host='0.0.0.0', debug=True)
Run the code above again and visit http://localhost:5000/metrics — you'll see the metrics data for Prometheus displayed as shown. At the bottom is the metric named usdt_vnd that we defined, along with its current value.
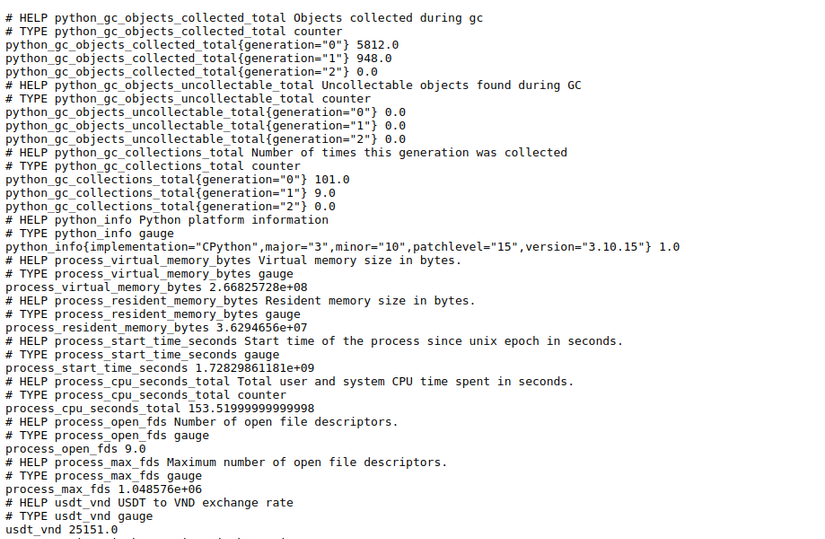
So we've finished the first and also the most tedious part. Next we'll set up Prometheus and Grafana to store the data.
Prometheus
For Prometheus, I chose to just run it as a container for convenience. First, let's create a config file for Prometheus to pass into the container. Create a file prometheus.yml with the following content:
global:
  scrape_interval: 300s  # How frequently Prometheus will scrape targets
  evaluation_interval: 300s  # How frequently rules will be evaluated

scrape_configs:
  - job_name: 'usdt-metrics'  # Name of the job
    static_configs:
      - targets: ['172.16.1.16:5000']  # Change this to match the address of your running Python service
Then run the Prometheus container with this command:
docker run -d --name prometheus -p 9090:9090 -v ./prometheus.yml:/etc/prometheus/prometheus.yml prom/prometheusVisit Prometheus at localhost:9090, go to Status => Targets, and if you see the Endpoint with status UP like in the image below, you're good.
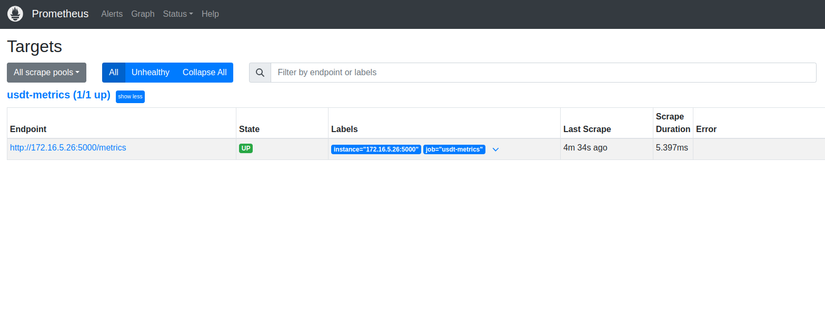
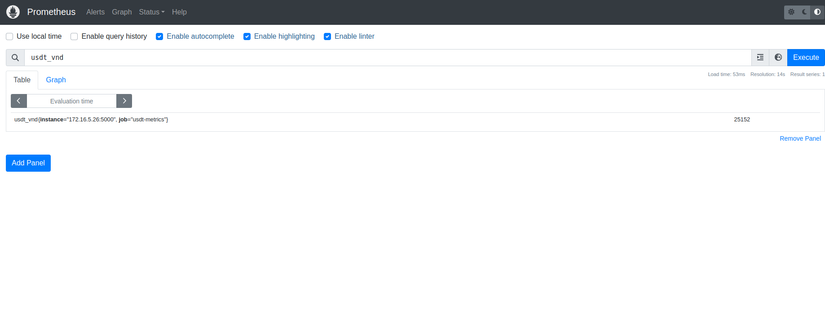
To double check, you can go to Graph to try querying the metric. Note that I set the interval to 5 minutes, so you might have to wait a bit for Prometheus to scrape the first batch of data.
Grafana
Finally, you can install Grafana to visualize the data collected in Prometheus. Run the Grafana container with this config:
docker run -d --name grafana -p 3000:3000 grafana/grafanaGo into Grafana and configure a Data Source to display it, via Connection => Data Sources => Add new datasource
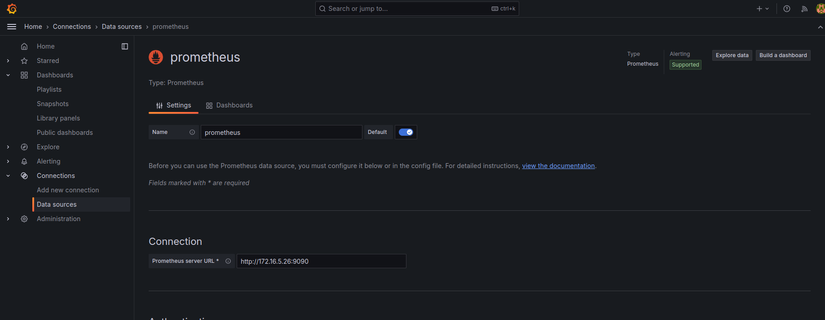
After you Save & Test the Prometheus data source successfully, you can start charting this metric.
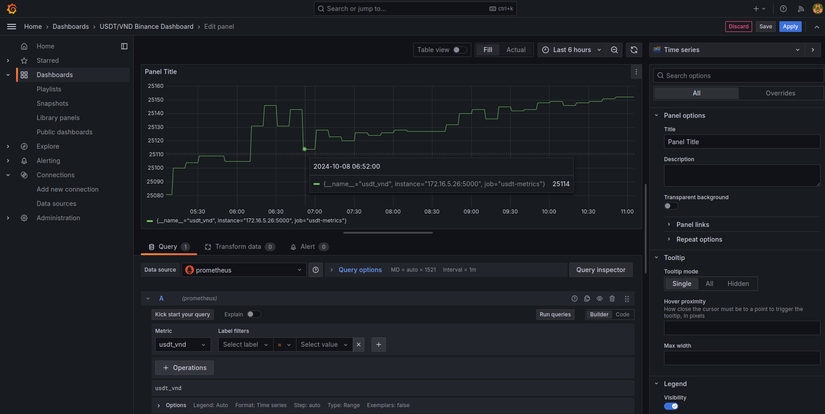
Go to the Dashboard section and try creating a dashboard with the metric named usdt_vnd.
Wrapping up
By using a Prometheus Exporter, we can "track literally any data we want." This post walked through the process of building a system to track the USDT/VND exchange rate. I hope this post gives you another solution to reach for at work.
If you found this post useful, don't hesitate to give me an Upvote and Follow me to catch more posts like this! Have a nice day!
If you're running into technical challenges or need help with systems, DevOps tools, I'm confident I can help. Get in touch at hoangviet.io.vn