Containers running in a Kubernetes environment can number in the hundreds or thousands running concurrently, so monitoring becomes very difficult without the right tools. In this post I want to introduce a tool that helps you monitor your K8s cluster comprehensively and effectively. I've been using this tool for a while and found it meets my needs quite well. This tool has a pretty catchy name: Robusta — let's see whether Robusta actually helps you work more effectively.

What is Robusta?
Robusta is a monitoring, tracing, and alerting tool built for a Kubernetes environment. Robusta integrates a lot of actions that let you quickly debug an error occurring in the cluster, not just stopping at detection and alerting. What can Robusta do?
- When a Pod or Job hits CrashLoopBackOff, it returns an alert along with the Pod's logs
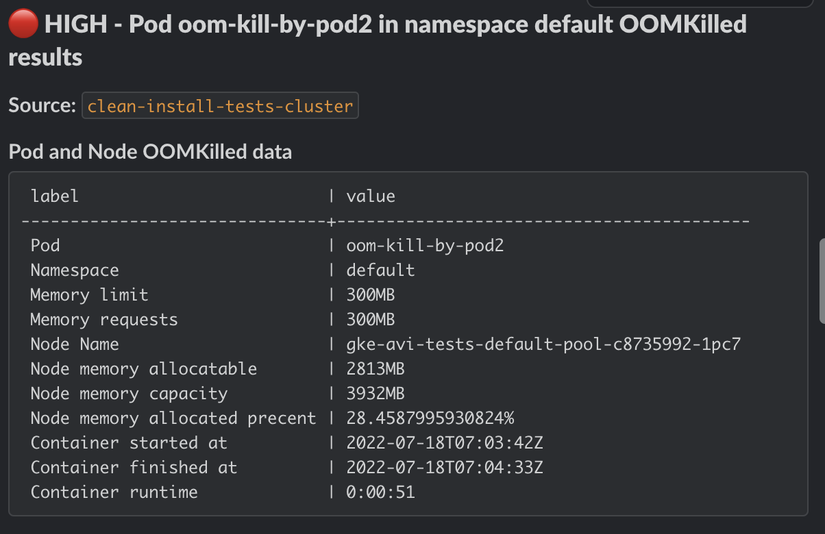
- When a Pod gets OOMKilled, it returns the memory history as a chart at the moment it was killed
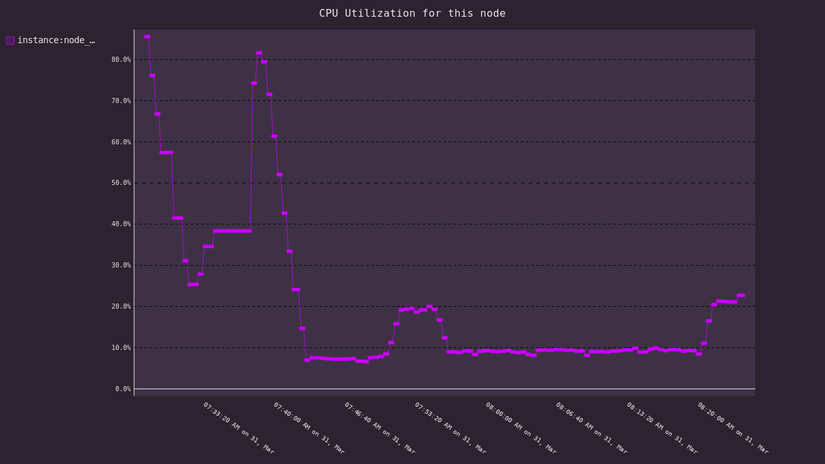
- When a pod's CPU usage hits a threshold, it returns that pod's CPU usage history or profiling.
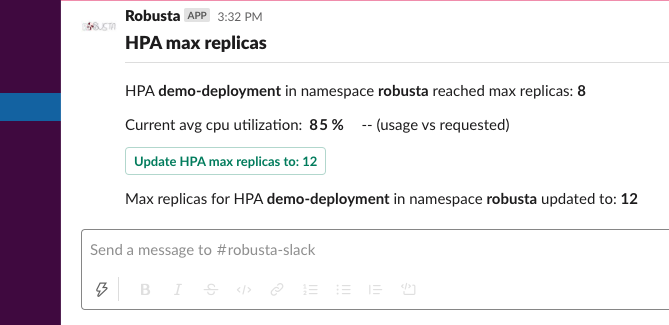
- Creates playbooks for specific cases. Example: increasing the replica count when CPU is high, etc.
- Integrates with Prometheus + AlertManager to alert on some extended rules.
- ....
Just from that quick rundown of what Robusta can do, you can already tell it's rare to find a free, open-source tool that can do all this, right?
Concepts in Robusta
Sink
A Sink is where alerts get sent. Robusta currently supports a fairly full range of tools to push notifications to: Telegram, Slack, Webhook, Discord, etc.
See the full list here: docs.robusta.dev The Slack Sink currently gets the most feature support — other sinks might not support every feature fully.
Playbook
Playbook is understood as a set of configurations covering detection, investigation, and alerting.
A playbook config includes: Trigger, Actions, Sink
- Events sent to Robusta get checked against the condition configured in the trigger
- When an event matches the trigger, the playbook gets activated
- The related playbook runs
- All actions configured in the playbook run.
- If the playbook generates a notification, it gets sent to the sinks in the config.
Example:
builtinPlaybooks:
- triggers:
  - on_pod_crash_loop:
      restart_reason: "CrashLoopBackOff"
  actions:
  - report_crash_loop: {}
  sinks:
  - "telegram-dev"
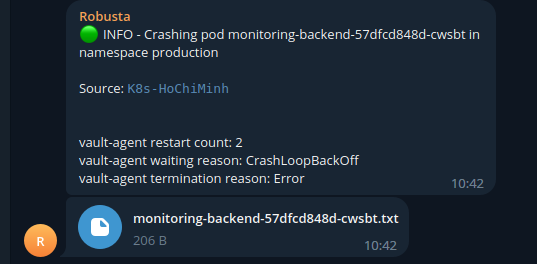
Above is a playbook that detects pods hitting CrashLoopBackOff. Once it detects a broken pod, Robusta runs the report_crash_loop action, which includes returning the pod's most recent logs and some info like restart count, to the telegram-dev sink, for example like this:
Configuration
In this post I'll introduce a few common Triggers and Actions in Robusta — you can learn more in the docs (docs.robusta.dev)
Trigger types
Based on the API Server: with this trigger type, Robusta detects events through K8s's API Server — this trigger can detect crashed pods, failed jobs, warning events, create-delete-update events on K8s resources (Pod, StatefulSet, Deployment, Daemonset, etc.)
This is also the most commonly used trigger type — a few trigger names in this category: on_pod_create, on_kubernetes_warning_event_create, on_job_failure, on_pod_crash_loop, etc.
Based on Prometheus and AlertManager: This trigger type is usually used to integrate some rules you've configured in AlertManager, or ones Robusta doesn't support. This trigger type lets you integrate a wide variety of trigger types from outside K8s.
Trigger name in this category: on_prometheus_alert Here's an example with a trigger based on an alert named HostHighCpuLoad from AlertManager that returns the result of running the command "ps aux", listing currently running processes:
customPlaybooks:
- triggers:
  - on_prometheus_alert:
      alert_name: HostHighCpuLoad
  actions:
  - node_bash_enricher:
     bash_command: ps aux
There are also plenty of other trigger types — feel free to explore more.
Action types
Event Enrichment: This action lets you pull additional data about a resource, usually for debugging. The info returned by this action is usually: Logs, Running processes, Resource usage graphs
Remediation: This action lets you modify a resource in K8s when triggered, like: deleting a Job, deleting a Pod, increasing the max replicas in an HPA once that HPA hits its threshold.
Language Troubleshooting: This action type lets you debug based on each language — currently Robusta supports debugging for 2 languages: Python and Java. With this Action, Robusta returns profiling info, attaches to the pod, gets a process's memory info, etc.
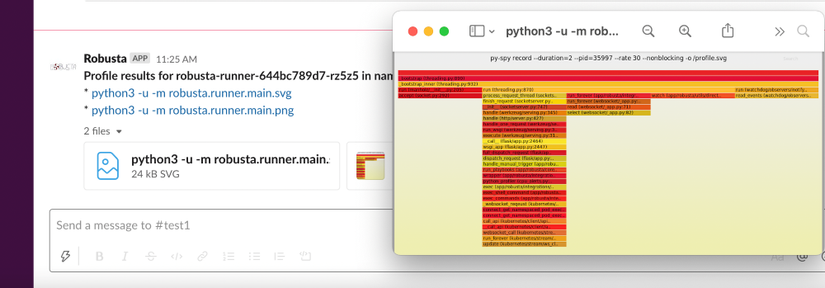
There are also plenty of other interesting action types — feel free to explore further.
Installation
To install Robusta you use Helm — the install is fairly easy, you can check it out here:
docs.robusta.dev/master/quick-start.html
If you run into any difficulty installing it, feel free to comment below the post!
Wrapping up
Robusta also has plenty of other neat features, but I'll stop here since I'm a bit lazy 😄. In short, Robusta is a fairly useful Observability tool with the full range of features from Detection => Tracing => Alerting. Robusta is also developing very quickly right now, and I expect it to be a potentially popular tool in the future. Hope you learned about another neat tool for your work after this post. If this post helped you, please give me an Upvote and Follow me to see more posts! Thanks!
If you're running into technical challenges or need help with systems, DevOps tools, I'm confident I can help. Get in touch at hoangviet.io.vn