What is CI/CD?
In the CI (Continuous Integration) step, every time a developer pushes new code to Git, the system automatically checks whether that code has issues (e.g. running unit tests, checking code style, doing a trial build...). This lets you catch bugs early and fix them while they're still easy.
Once the code is solid, comes the CD part. Depending on how a team is organized, CD can mean:
Continuous Delivery: the code is packaged and ready to deploy, but still needs someone to hit a button to push it to the real environment.
Continuous Deployment: the code gets automatically deployed to the real environment, no manual step needed.
Thanks to CI/CD, you save a lot of time on testing and deploying software, while reducing the risk of human error from doing it manually.
In this post I'll share what a "complete" real-world CI/CD flow looks like, based on my own experience as a DevOps Engineer.
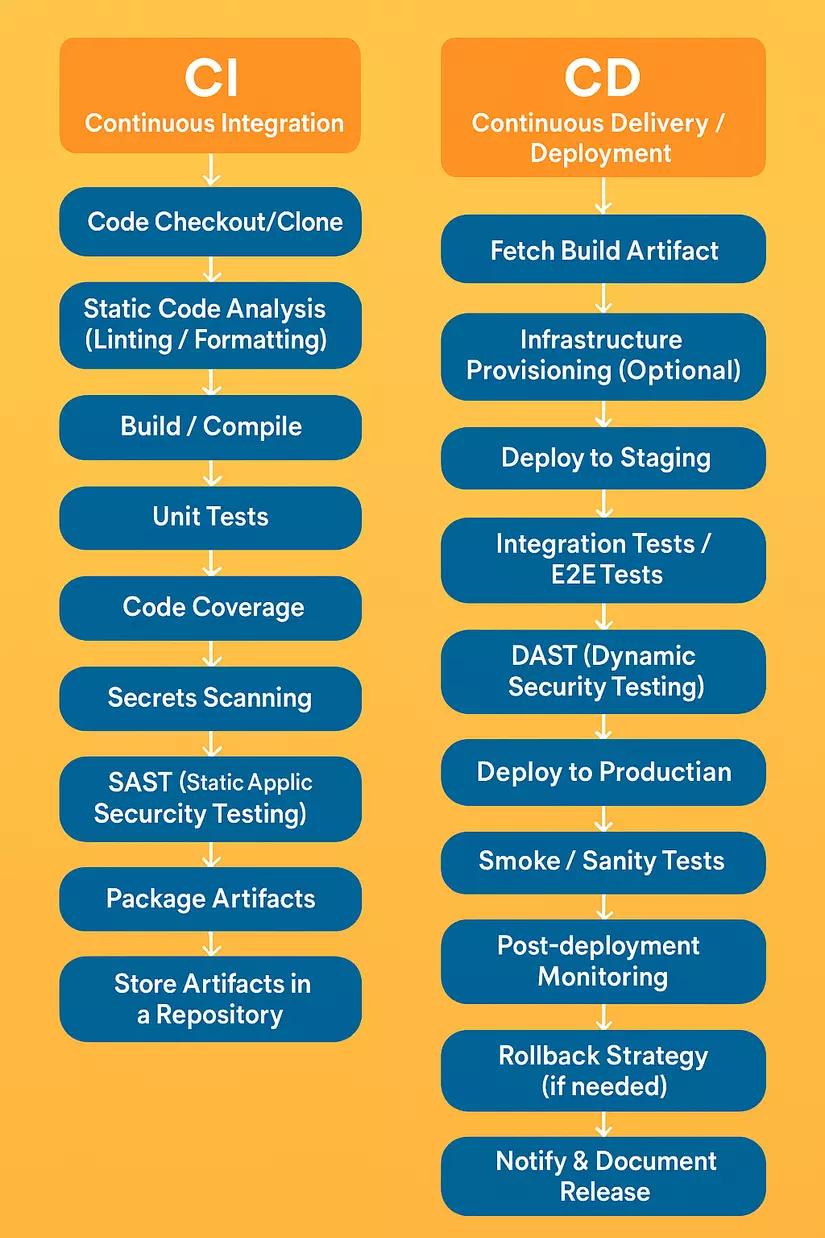
1. Continuous Integration
1.1 Code Checkout / Clone
Before starting any CI/CD process, we need to pull/clone the source code from a repository like GitHub or GitLab so we can build a finished version or run tests on the source code.
| Category | Common tools |
|---|---|
| Source Control | GitHub, GitLab, Bitbucket, Azure Repos, Gitea,... |
1.2 Build / Install dependencies
Installing dependencies downloads and installs third-party libraries, dependent packages, or related install artifacts that you can't see directly in the source code without running the install step.
This step is necessary for the subsequent analysis steps to run effectively. Depending on whether your application runs as a container and which language it's written in, you can pick the appropriate tool.
| Category | Common tools |
|---|---|
| Per-language build tools | Maven, Gradle, sbt, npm/yarn/pnpm, pip/Poetry, Cargo, Go modules, Bazel, Buck, CMake, Make, MSBuild, dotnet CLI |
| Container & image build | Docker CLI/BuildKit, Buildah, Kaniko, Podman, Jib, ko, img, buildpacks (Paketo, Cloud Native Buildpacks) |
1.3 Static Code Analysis
When a development team works together, a lot of code gets written every day. Even when everyone tries to write good code, humans still make mistakes, especially small ones that are hard to spot right away.
Static Code Analysis is where you use tools to automatically check the source code without running the application. It's like spell-checking a document before sending an email — except here you're checking for bugs in code.
The input for this step is the
source codeandcontainer imagefrom the two steps above.
These analysis steps can run in parallel to save time.
| Type of analysis | Common tools | Purpose |
|---|---|---|
| Lint / style check | ESLint, Pylint, Flake8, RuboCop, Prettier, Stylelint, go vet, golangci-lint | Checks syntax errors, standardizes code per convention, makes code easier to read and maintain |
| Unit testing & coverage | JUnit, TestNG, pytest, unittest, jest, mocha, RSpec, go test, NUnit, xUnit | Makes sure functions/modules work as expected and measures test coverage |
| Code coverage reporting | JaCoCo, Istanbul/nyc, Coverlet, Codecov, SonarCloud, Clover | Visualizes which parts of the source code have been tested, helping improve test quality |
| Static application security testing (SAST) | SonarQube, Semgrep, Checkmarx, Veracode, GitHub CodeQL, Fortify, Coverity | Scans source code to catch potential security vulnerabilities before the app is built or run |
| Secrets detection | TruffleHog, Gitleaks, Detect-Secrets, GitGuardian | Detects sensitive info (API keys, passwords...) leaked in the source code |
| License & SCA (open-source risk) | Snyk, Black Duck, WhiteSource, Mend (formerly WhiteSource), FOSSA, OWASP Dependency-Check | Checks that open-source libraries use valid licenses and contain no security vulnerabilities |
| Container scanning | Trivy, Grype, Clair, Anchore, Snyk, Docker Scout, Aqua, Prisma Cloud | Analyzes the container image to detect security vulnerabilities, outdated libraries, or unsafe configuration |
1.4 Build Artifact Packaging & Signing
Once the steps above pass with good results and no serious issues, we move to the next step: packaging the application and pushing it to a repository.
The following steps need to run sequentially.
| Step | Purpose | Common tools | Plain explanation |
|---|---|---|---|
| 1. Package binaries | Package the built source code into a standard format for use or deployment | JAR, WAR, NuGet, PyPI wheels, OCI images, Helm charts, Debian/RPM, container SBOM | Once built, the code gets packaged into files a system or user can use. Depending on language/environment, the format might be a JAR (Java), a PyPI package (Python), a Docker image, a Helm chart (K8s), etc. A container SBOM is the list of components in the image, used for security checks. |
| 2. Artifact/Image signing & provenance (optional) | Digitally sign and verify provenance (who created it, was it tampered with) to guarantee the package's trustworthiness and safety | cosign, Notary v2, JReleaser, GPG, AWS KMS, HashiCorp Vault | Like signing or stamping a package — a digital signature confirms this artifact is "genuine" and hasn't been tampered with. If something goes wrong later, you can trace exactly who built it and whether it was interfered with. |
| 3. Push artifacts | Push the packaged, signed artifact/image to a repository so other environments (dev, staging, prod) can access and deploy it | JFrog Artifactory, Sonatype Nexus, GitHub Packages, GitLab Package Registry, Azure Artifacts, S3/GCS buckets, Docker Hub, ECR, GCR, OCI-compatible registries | The artifact gets uploaded to a "storehouse" (registry or artifact store) so others (or the CI/CD system) can pull it down. Example: uploading a Docker image to Docker Hub, a Helm chart to a GCS bucket, or a .jar to GitHub Packages. This is the bridge between the build process and the real deployment environment. |
At this point, we've essentially finished the CI - Continuous Integration step.
2. Continuous Delivery / Deployment
2.1 Fetch Build Artifact
Starting the CD step, we need to download or fetch information about the Build Artifact produced at the end of the CI process.
Downloading the image/executable lets us deploy the application to different environments in the following steps.
2.2 Deploy non-production environment
In practice, we'll always have test environments like Dev, Staging, UAT, Preprod, so stakeholders can check whether the application behaves as expected.
As a DevOps Engineer, we can integrate tools to automate testing on these environments.
Depending on which deployment strategy you want to use, you'll have different tool choices.
| Deployment strategy | Tools |
|---|---|
| Helm package & release | Helm, Helmfile, Reckoner |
| Progressive delivery (GitOps) | Argo CD, Flux CD, Jenkins X, Google Config Sync, Spinnaker, Harness CD |
| Blue/Green & canary | Flagger, Argo Rollouts, Spinnaker, Istio, Linkerd, AWS CodeDeploy |
| Serverless deploy | Serverless Framework, AWS SAM, Terraform, Pulumi, SST |
| Mobile / desktop release | Fastlane, Microsoft App Center, Google Play Console pipelines |
| Feature flag rollout | LaunchDarkly, Flagsmith, Unleash, Split, CloudBees Rollout |
2.3 Run tests/scans on non-production environments
Running tests on non-production environments can happen multiple times across multiple environments.
Depending on the type of application, you need to pick the appropriate types of tests — you don't necessarily need to run every single one of these.
| Test type | Common tools | Purpose |
|---|---|---|
| Browser / UI Testing | Selenium WebDriver, Cypress, Playwright, TestCafe, Puppeteer | Simulates a user interacting in the browser to test the interface and flow of a web app |
| Mobile App Testing | Appium, Detox, Espresso | Tests the functionality and UI of a mobile app (Android/iOS) like a real user |
| Load & Performance Testing | JMeter, Gatling, Locust, K6, Artillery, Vegeta | Measures app performance under many concurrent users, finds bottlenecks, measures response time |
| Chaos / Resiliency Testing | Gremlin, ChaosMesh, LitmusChaos, PowerfulSeal | Tests the system's fault tolerance by simulating failures (network loss, service death...) |
| Black-box DAST (Security) | OWASP ZAP, Burp Suite Pro, Arachni, Netsparker, Tenable Web App Scan | Scans a running app for security holes (like an external hacker would), finding things like XSS, SQLi... |
| Fuzz Testing (Security) | Jazzer, go-fuzz, libFuzzer, AFL++, Defensics | Feeds random data into the app to find crashes or unknown security bugs (zero-day) |
| Container Image Scanning | Trivy, Grype, Anchore Engine, Clair, Aqua Microscanner | Checks the Docker image for libraries with vulnerabilities or unsafe configuration |
2.4 Deploy production environment
After tests and security scans run directly on the non-production environment with no issues, we can move to the next step and deploy to production for real users.
The tools for deploying to production are typically the same as for non-production.
Deploying to production should require manual approval to avoid incidents.
2.5 Post-Deployment Validation
Deploying to production isn't the end of the CI/CD pipeline. Once again, after the production deploy completes with no issues, we need to re-run or add a few more types of tests to make sure nothing that worked fine in non-production breaks in production.
| Test type | Tools |
|---|---|
| Smoke / sanity tests in target env | Bats-core, newman, curl + bash scripts, canary synthetic checks |
| Contract & health checks | Spring Boot Actuator, Kubernetes readiness/liveness probes |
2.6 Rollback & Disaster Recovery
This is a step a lot of people forget. It lets you roll the application back to the immediately previous version when the new one has issues. The tool used for rollback is usually the same tool you use to deploy the application.
| Task | Common tools |
|---|---|
| Automatic rollback on incident | Argo Rollouts, Spinnaker, Harness, Kubernetes Deployments with health-checks |
| Disaster Recovery | Velero, AWS Backup, Azure Backup, Google Cloud Backup & DR |
2.7 Notify & Document Release
In this final step, we need to send out a notification about the new version's status and what changed, to stakeholders — that could be the dev team, customers, PMs, and so on.
| Purpose | Tools |
|---|---|
| Auto-generated docs | mkdocs-material, Docusaurus, Sphinx, Swagger/OpenAPI, Storybook |
| Release notes & changelog | Release Drafter, auto-changelog, GitHub Releases, Keep a Changelog |
| ChatOps notifications | Slack Apps/Bot, Microsoft Teams, Mattermost, Discord webhooks |
Infrastructure pipeline (Bonus)
Besides pipelines for deploying the application, there are also pipelines for provisioning the infrastructure that runs the application. Here are a few tools worth knowing for this infrastructure-provisioning pipeline:
Infrastructure-as-Code (IaC) & Policy Scan
| Format | Validators / linters |
|---|---|
| Terraform | terraform validate, TFLint, tfsec, Checkov, Terrascan, Infracost, Regula |
| Kubernetes manifests | kube-score, kube-lint, Kubeval, Kube-No-Trouble, Polaris, OPA Conftest |
| Helm charts | helm lint, chart-testing, Datree |
| CloudFormation | cfn-lint, CFN-Guard |
| Packer | packer validate, Packer Inspector |
Environment Provisioning & Configuration
| Automation layer | Popular tools |
|---|---|
| Provision infra | Terraform, Pulumi, Crossplane, AWS CloudFormation, Azure Bicep, Google Cloud Config Connector |
| Configuration management | Ansible, Chef, Puppet, SaltStack |
| Container platform bootstrapping | Kubernetes (kops, kube-adm), EKS-Blueprints, Rancher, OpenShift, K3s, Kind for testing |
| Secrets & parameter store | HashiCorp Vault, AWS Secrets Manager, Azure Key Vault, Sealed Secrets, Doppler |
Wrapping up
That covers the main steps in a typical CI/CD pipeline today, along with the tools you can use at each one. Hope this gives you a good overview of what a CI/CD pipeline needs.
If this post was useful, feel free to Follow and Upvote to support me. Thanks! ❤️
If you're running into technical challenges, need help with systems, DevOps tools, or career direction, I'm confident I can help. Get in touch at hoangviet.io.vn — I'd love to chat and collaborate with you.