As the title says, in this post I'll walk you through how to analyze logs, extracting fields from the Apache Web Server's logs — for logs from other software, the approach is fairly similar so you can apply it there too.
ELK Stack overview
ELK Stack is short for the 3 words (Elasticsearch - LogStash - Kibana) — these 3 tools together create an environment that lets us analyze, centrally store, search, and visualize logs so we can access them more easily.
Let's go through each tool in this Stack:
- Beats - Filebeat: This software gets installed on the servers we want to pull logs from. It lets us pick which types of logs to pull and pushes logs to LogStash for pre-processing, or sends them directly to Elasticsearch.
- LogStash: This software lets us filter out the fields we need from the log, or modify the log before sending it to Elasticsearch.
- ElasticSearch: Logs get stored and searched quickly here.
- Kibana: Software that visualizes logs as charts, bars, etc.
Analyzing the Apache Log
First, before analyzing the log, we need to know which log types Apache writes out. By default Apache writes 2 log types: Access Log and Error Log, in the directory /var/log/apache2/

Let's take a look at the Access Log's format:

Basically, we understand each field of the Apache Access Log this way:
If we push this log to ElasticSearch as-is by default, it'll be a mess, and we won't be able to break out the fields we need. So we'll need to filter out the fields at LogStash using plugins. We can reference sample pipelines for analyzing common software logs on Elastic.co's homepage.
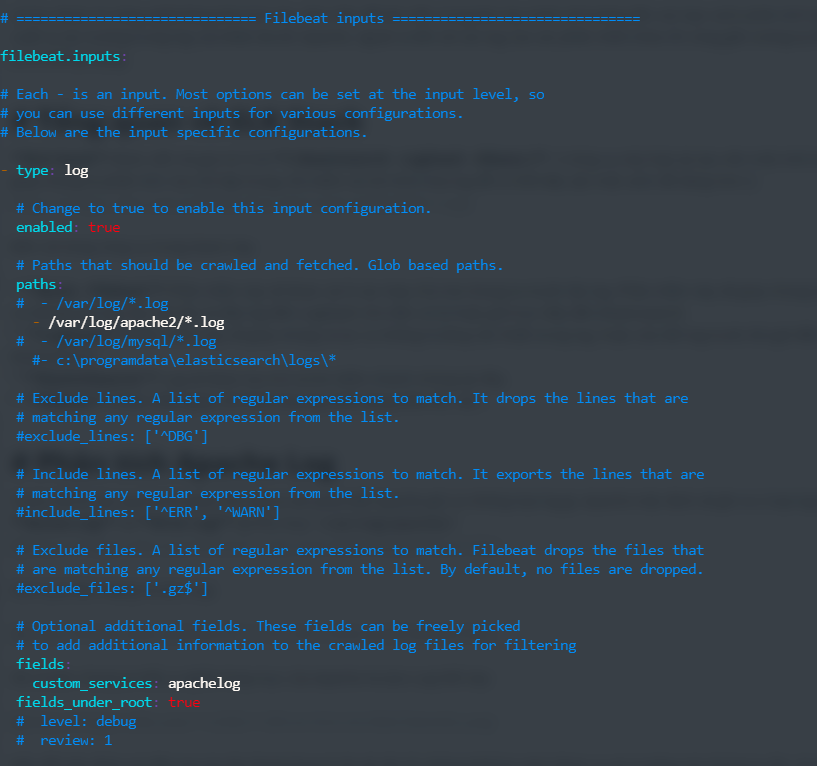
First, on Filebeat, on the machine we want to pull logs from, we add a field "custom_services: apachelog" under "filebeat.inputs:" in the file /etc/filebeat/filebeat.yml, as shown, so we can identify this log stream once it's pushed to LogStash:
Back to LogStash on the ELK Stack Server, I use a YAML file with the config below, saved at /etc/logstash/conf.d/apache2-pipeline.conf.
input {
  beats {
    port => 5044
    host => "0.0.0.0"
  }
}
filter {
   if [custom_services] == "apachelog" {
      grok {
        match => { "message" => ["%{IPORHOST:clientip} - %{DATA:username} \[%{HTTPDATE:http_date}\] \"%{WORD:method} %{DATA:path} HTTP/%{NUMBER:apache_http_version}\" %{NUMBER:code} %{NUMBER:sent_bytes}( \"%{DATA:referrer}\")?( \"%{DATA:agent}\")?",
          "%{IPORHOST:clientip} - %{DATA:username} \\[%{HTTPDATE:http_date}\\] \"-\" %{NUMBER:code} -" ] }
        }
        mutate {
          rename => {
            "clientip" => "apache_remote_ip"
            "username" => "apache_user"
            "http_date" => "apache_access_time"
            "method" => "apache_method"
            "path" => "apache_path"
            "code" => "apache_code"
            "apache_http_version" => "apache_http_version"
            "sent_bytes" => "apache_sent_bytes"
            "referrer" => "apache_referrer"
            "agent" => "apache_agent"
          }
        }
   }
}
output {
  elasticsearch {
    hosts => localhost
    manage_template => false
    index => "%{[@metadata][beat]}-%{[@metadata][version]}-%{+YYYY.MM.dd}"
  }
}
To explain it simply: for input where the field "custom_services" equals "apachelog", it looks at the message field and parses it using pre-built formats like: IPRHOST, HTTPDATE, NUMBER, etc. Then we rename the parsed components pulled from message using mutate and rename. The input and output blocks are the data flow. Once configured, restart the services to load the new config.
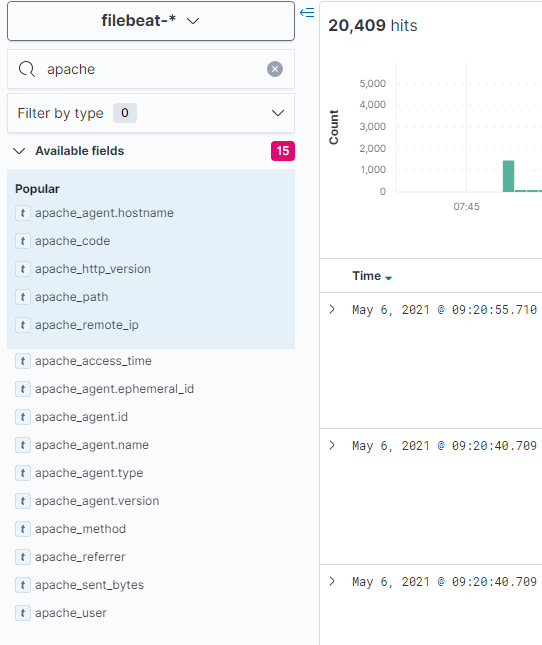
Once updated, we'll see these newly filtered fields show up on ElasticSearch.
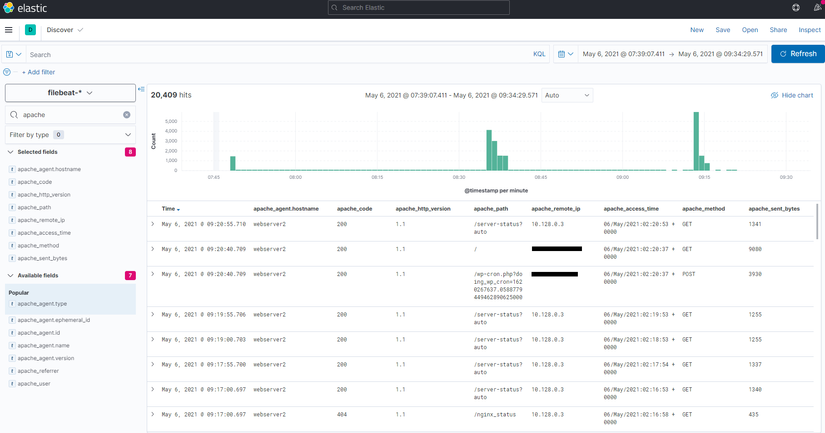
From there, we can select and display the necessary info, and it becomes much easier to visualize.
Wrapping up
I'm a newbie, so there will definitely be gaps and mistakes — if you have feedback, comment and let me know. Hope this post gives you a bit more knowledge. Have a nice day!
If you're running into technical challenges or need help with systems, DevOps tools, I'm confident I can help. Get in touch at hoangviet.io.vn